

Dashboard
Fleet-level numbers — idle cost, fleet score, activity and trends — which of them are worth acting on, and which move for reasons that are not real.
The map answers where is it. The dashboard answers how did the fleet do.
Switch to it with the Dashboard tab next to Map View. Set the period with the date selector at the top right — everything below it recalculates.
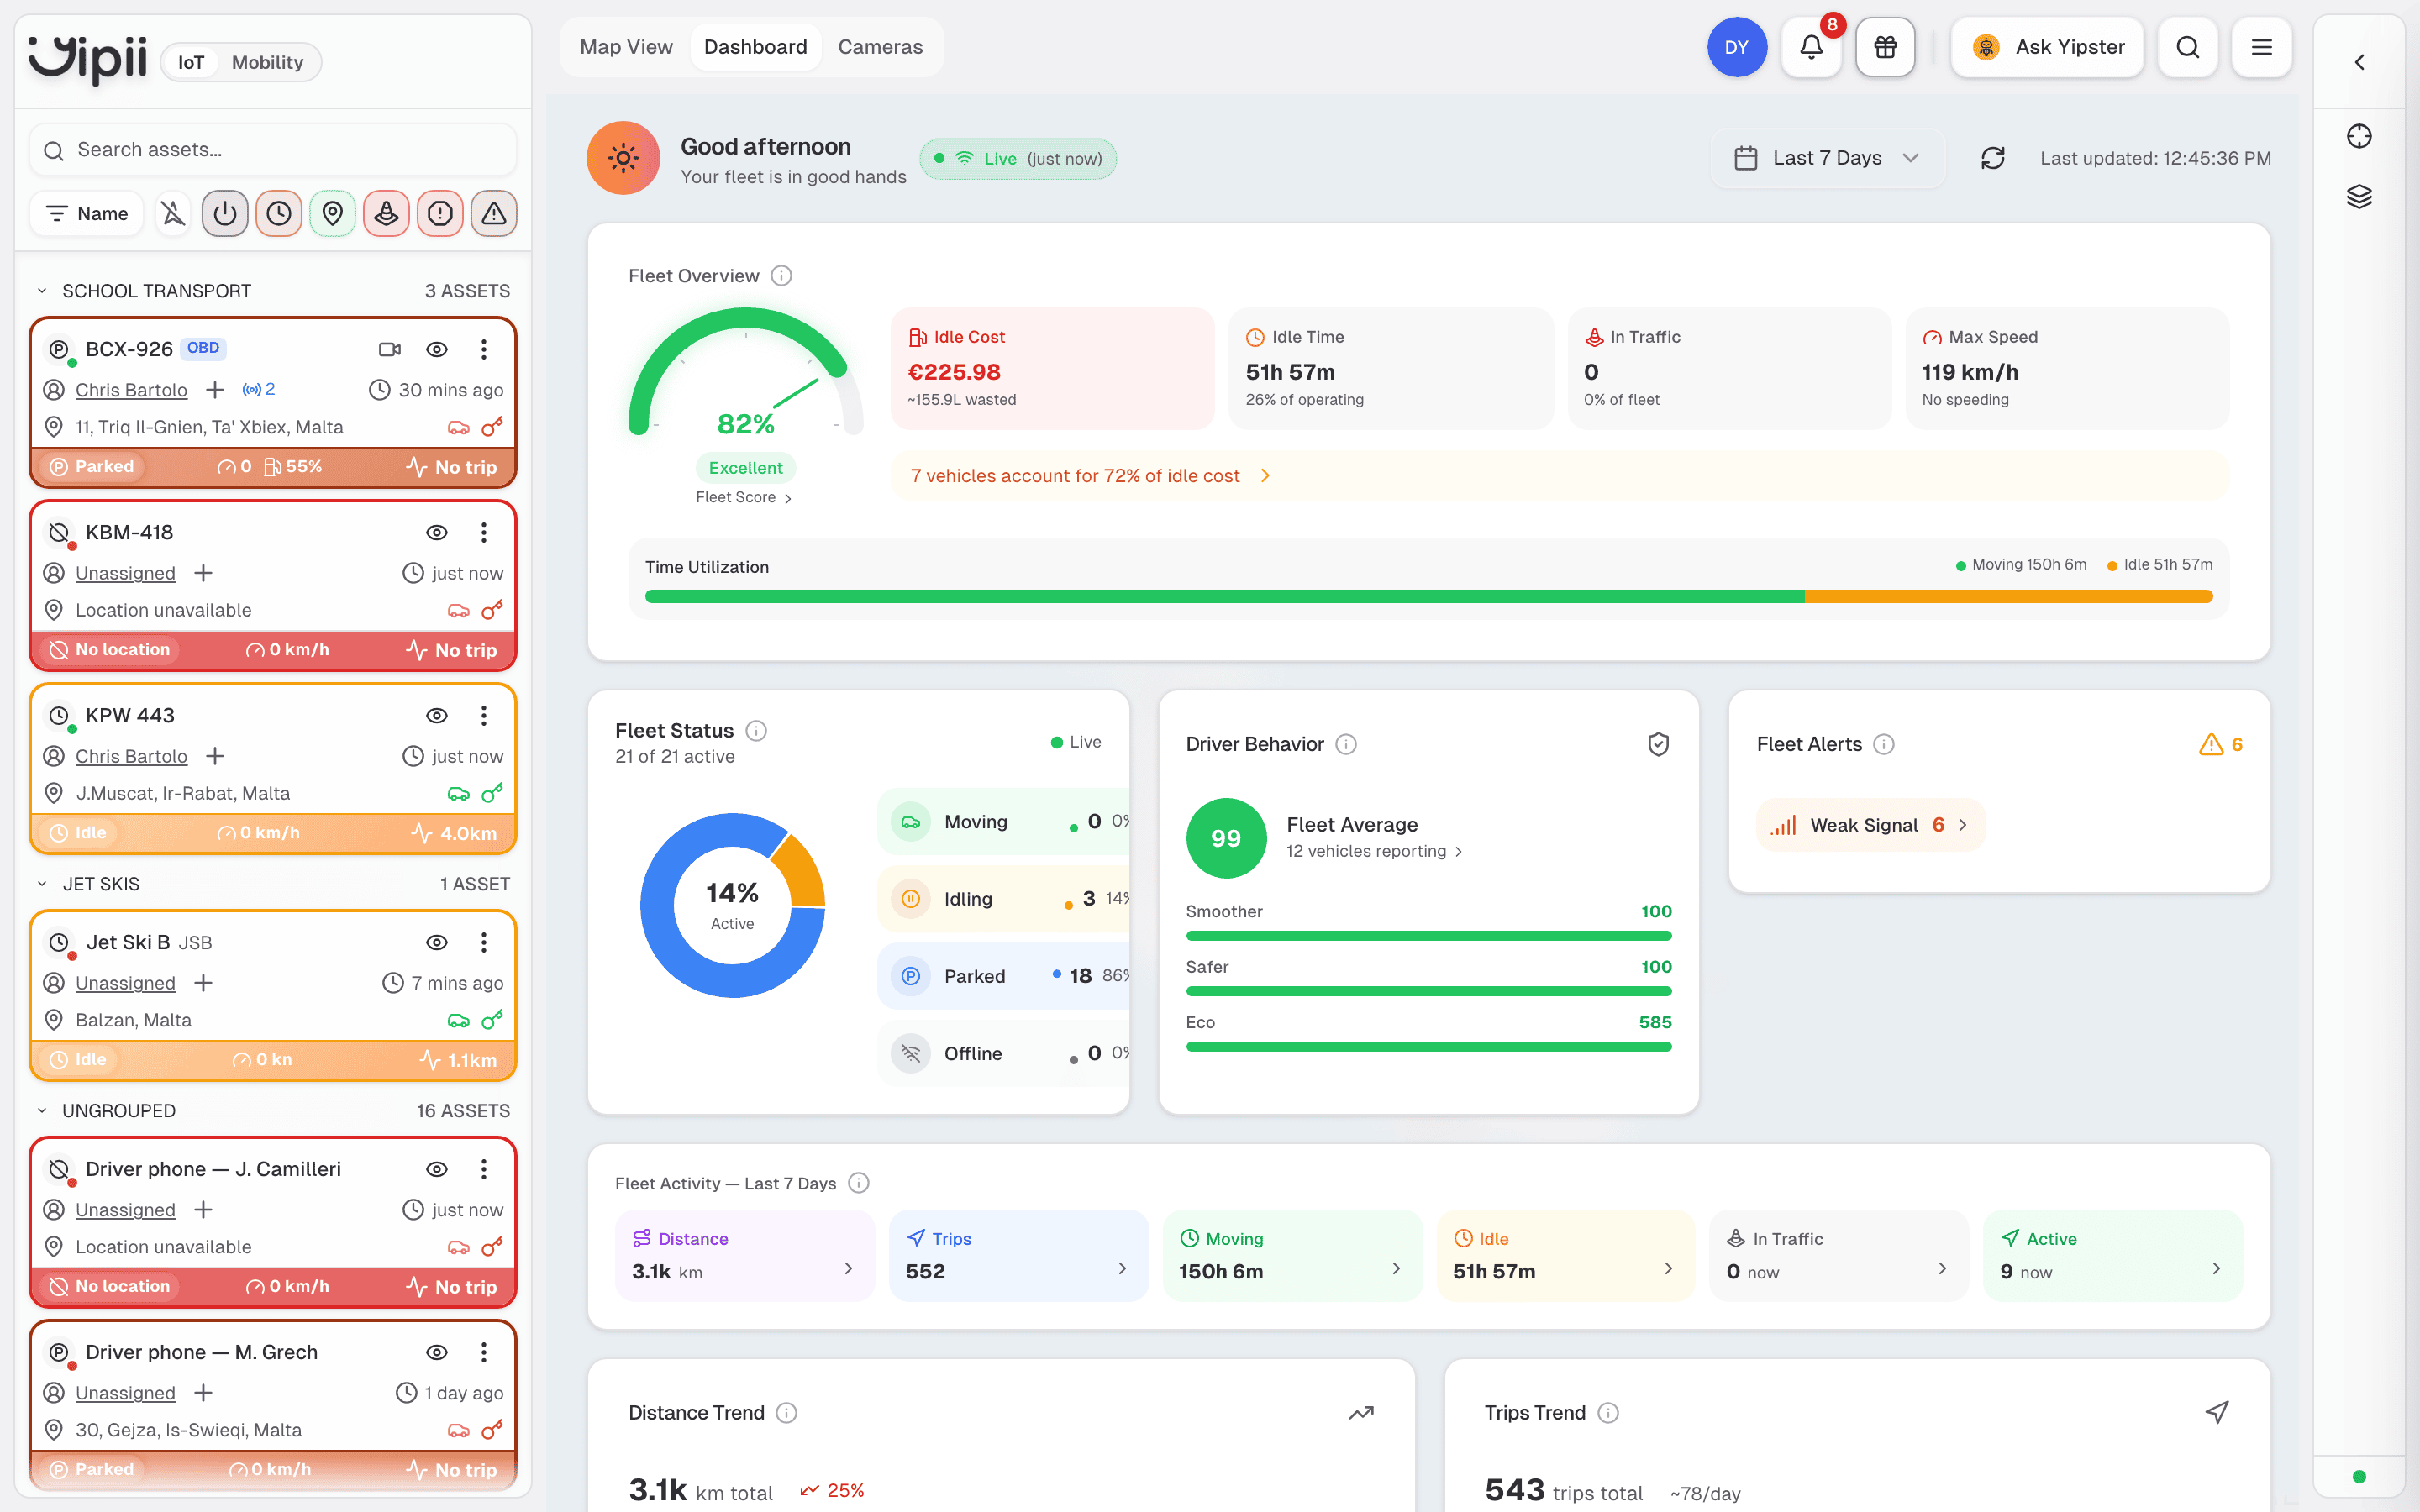
Fleet Overview
The panel at the top is the one to read first.
| Figure | What it is |
|---|---|
| Fleet Score | A single 0–100 rating with a word attached — Excellent at the top end |
| Idle Cost | Money burned idling over the period, with the litres wasted underneath |
| Idle Time | Hours idling, and what share of operating time that was |
| In Traffic | How many vehicles are in congestion right now |
| Max Speed | The fastest recorded speed, and whether it counted as speeding |
Underneath, a line reads something like 7 vehicles account for 73% of idle cost. Click it. Idle is almost never spread evenly — it concentrates in a handful of vehicles, routes or drivers, and that line takes you straight to them. It is the most actionable thing on the page.
The Time Utilization bar splits the period into moving versus idle. A bar that is a third amber is a fleet with a real problem, and it is visible from across a room.
Idle Cost is derived from idle time and a fuel price. Treat it as an order of magnitude for prioritising, not as an accounting figure.
Fleet Status
A donut of where the fleet is right now — Moving, Idling, Parked, Offline — with a count and percentage against each, and n of n active above it.
This is a snapshot, not a period figure. It does not change when you change the date range.
Driver Behavior
A fleet average out of 100, the number of vehicles reporting, and three sub-scores:
| Sub-score | Built from |
|---|---|
| Smoother | Harsh braking and harsh acceleration |
| Safer | Harsh cornering and speed patterns |
| Eco | Fuel-efficient driving |
These come from OBD-II data, so only OBD-capable hardware contributes — FMC003 and FMB003. "11 vehicles reporting" on a fleet of 21 is not a fault; it is 11 vehicles with the right trackers. See Trackers.
For per-driver rather than per-fleet numbers, use driver scoring.
Fleet Alerts
A count of what has fired, grouped by type — Weak Signal, and whatever else your alerts cover. Each row drills through to the assets involved.
An empty card here means either a healthy fleet or no alerts configured. Those are very different situations, and the card cannot tell them apart.
Fleet Activity
Six figures for the period: Distance, Trips, Moving, Idle, In Traffic and Active. Each opens a breakdown.
Distance Trend and Trips Trend plot the same numbers over time with a percentage change. The change is the useful part — 2.9k km means nothing on its own; 2.9k km and up 34% is a conversation about capacity.
Reading it well
Three habits make this page worth opening:
- Set the period before reading anything. Most of the panel is period-scoped; Fleet Status is not. Mixing the two produces confident wrong conclusions.
- Follow the concentration line. n vehicles account for x% is where the money is.
- Compare like with like. A fortnight with a bank holiday is not a bad fortnight.
If it doesn't work
| Symptom | Cause | Fix |
|---|---|---|
| Driver Behavior shows far fewer vehicles than you have | Only OBD-capable trackers produce these scores | FMC003 and FMB003 only. Nothing to fix on the other vehicles |
| Driver Behavior is empty | No OBD-capable hardware at all | Use driver scoring, which works from movement data |
| Fleet Status doesn't match the date range | It is live, not period-scoped | Correct behaviour. Use Fleet Activity for the period |
| Idle Cost looks too high | It counts every minute of ignition-on without movement, including PTOs and chillers | Check the vehicles behind the concentration line before acting |
| Distance is lower than the odometer | Yipii measures GPS distance over trips | The two never match exactly. Compare Yipii to Yipii |
| Numbers changed after a refresh | Late data arrived from a vehicle that was out of coverage | Normal. Positions are backfilled when a tracker reconnects |
| Fleet Alerts is empty | Either nothing fired, or nothing is configured | Check the Alerts screen — an empty card is ambiguous |
Related
- Statuses — what the donut segments mean.
- Driver scoring — per-driver, and not OBD-dependent.
- Reports — when you need the underlying rows.
- Alerts — so a problem finds you instead of waiting here.
Was this page helpful?