

Driver scoring
How the 0–100 score and A–F grade are calculated, what they are built from, how to use them for coaching, and what distorts them.
Every tracked vehicle gets a score out of 100 and a letter grade. The score is built from four things the tracking server counts on every trip:
- Harsh braking
- Harsh acceleration
- Harsh cornering
- Speeding
That is the whole model. There is no fuel, no idling and no punctuality in it — those are on the dashboard. This score measures how the vehicle is being driven, and nothing else.
How to read a grade
| Grade | Score | Label |
|---|---|---|
| A | 90–100 | Excellent |
| B | 75–89 | Good |
| C | 60–74 | Average |
| D | 45–59 | Poor |
| F | Below 45 | Critical |
The bands are deliberately wide at the top. A fleet where everyone sits on A is not a broken scale — harsh events are rare in normal driving, so an A means "nothing unusual happened", and anything below B is worth a conversation.
At fleet level these are per vehicle, not per person, unless drivers are being identified. A van shared by three drivers produces one score covering all three. To attribute driving to people, assign drivers or issue iButtons or beacons.
Where to find it
Open Drivers from the main menu. The page has four tabs: Performance, Timesheets, Communication and Manage Drivers.
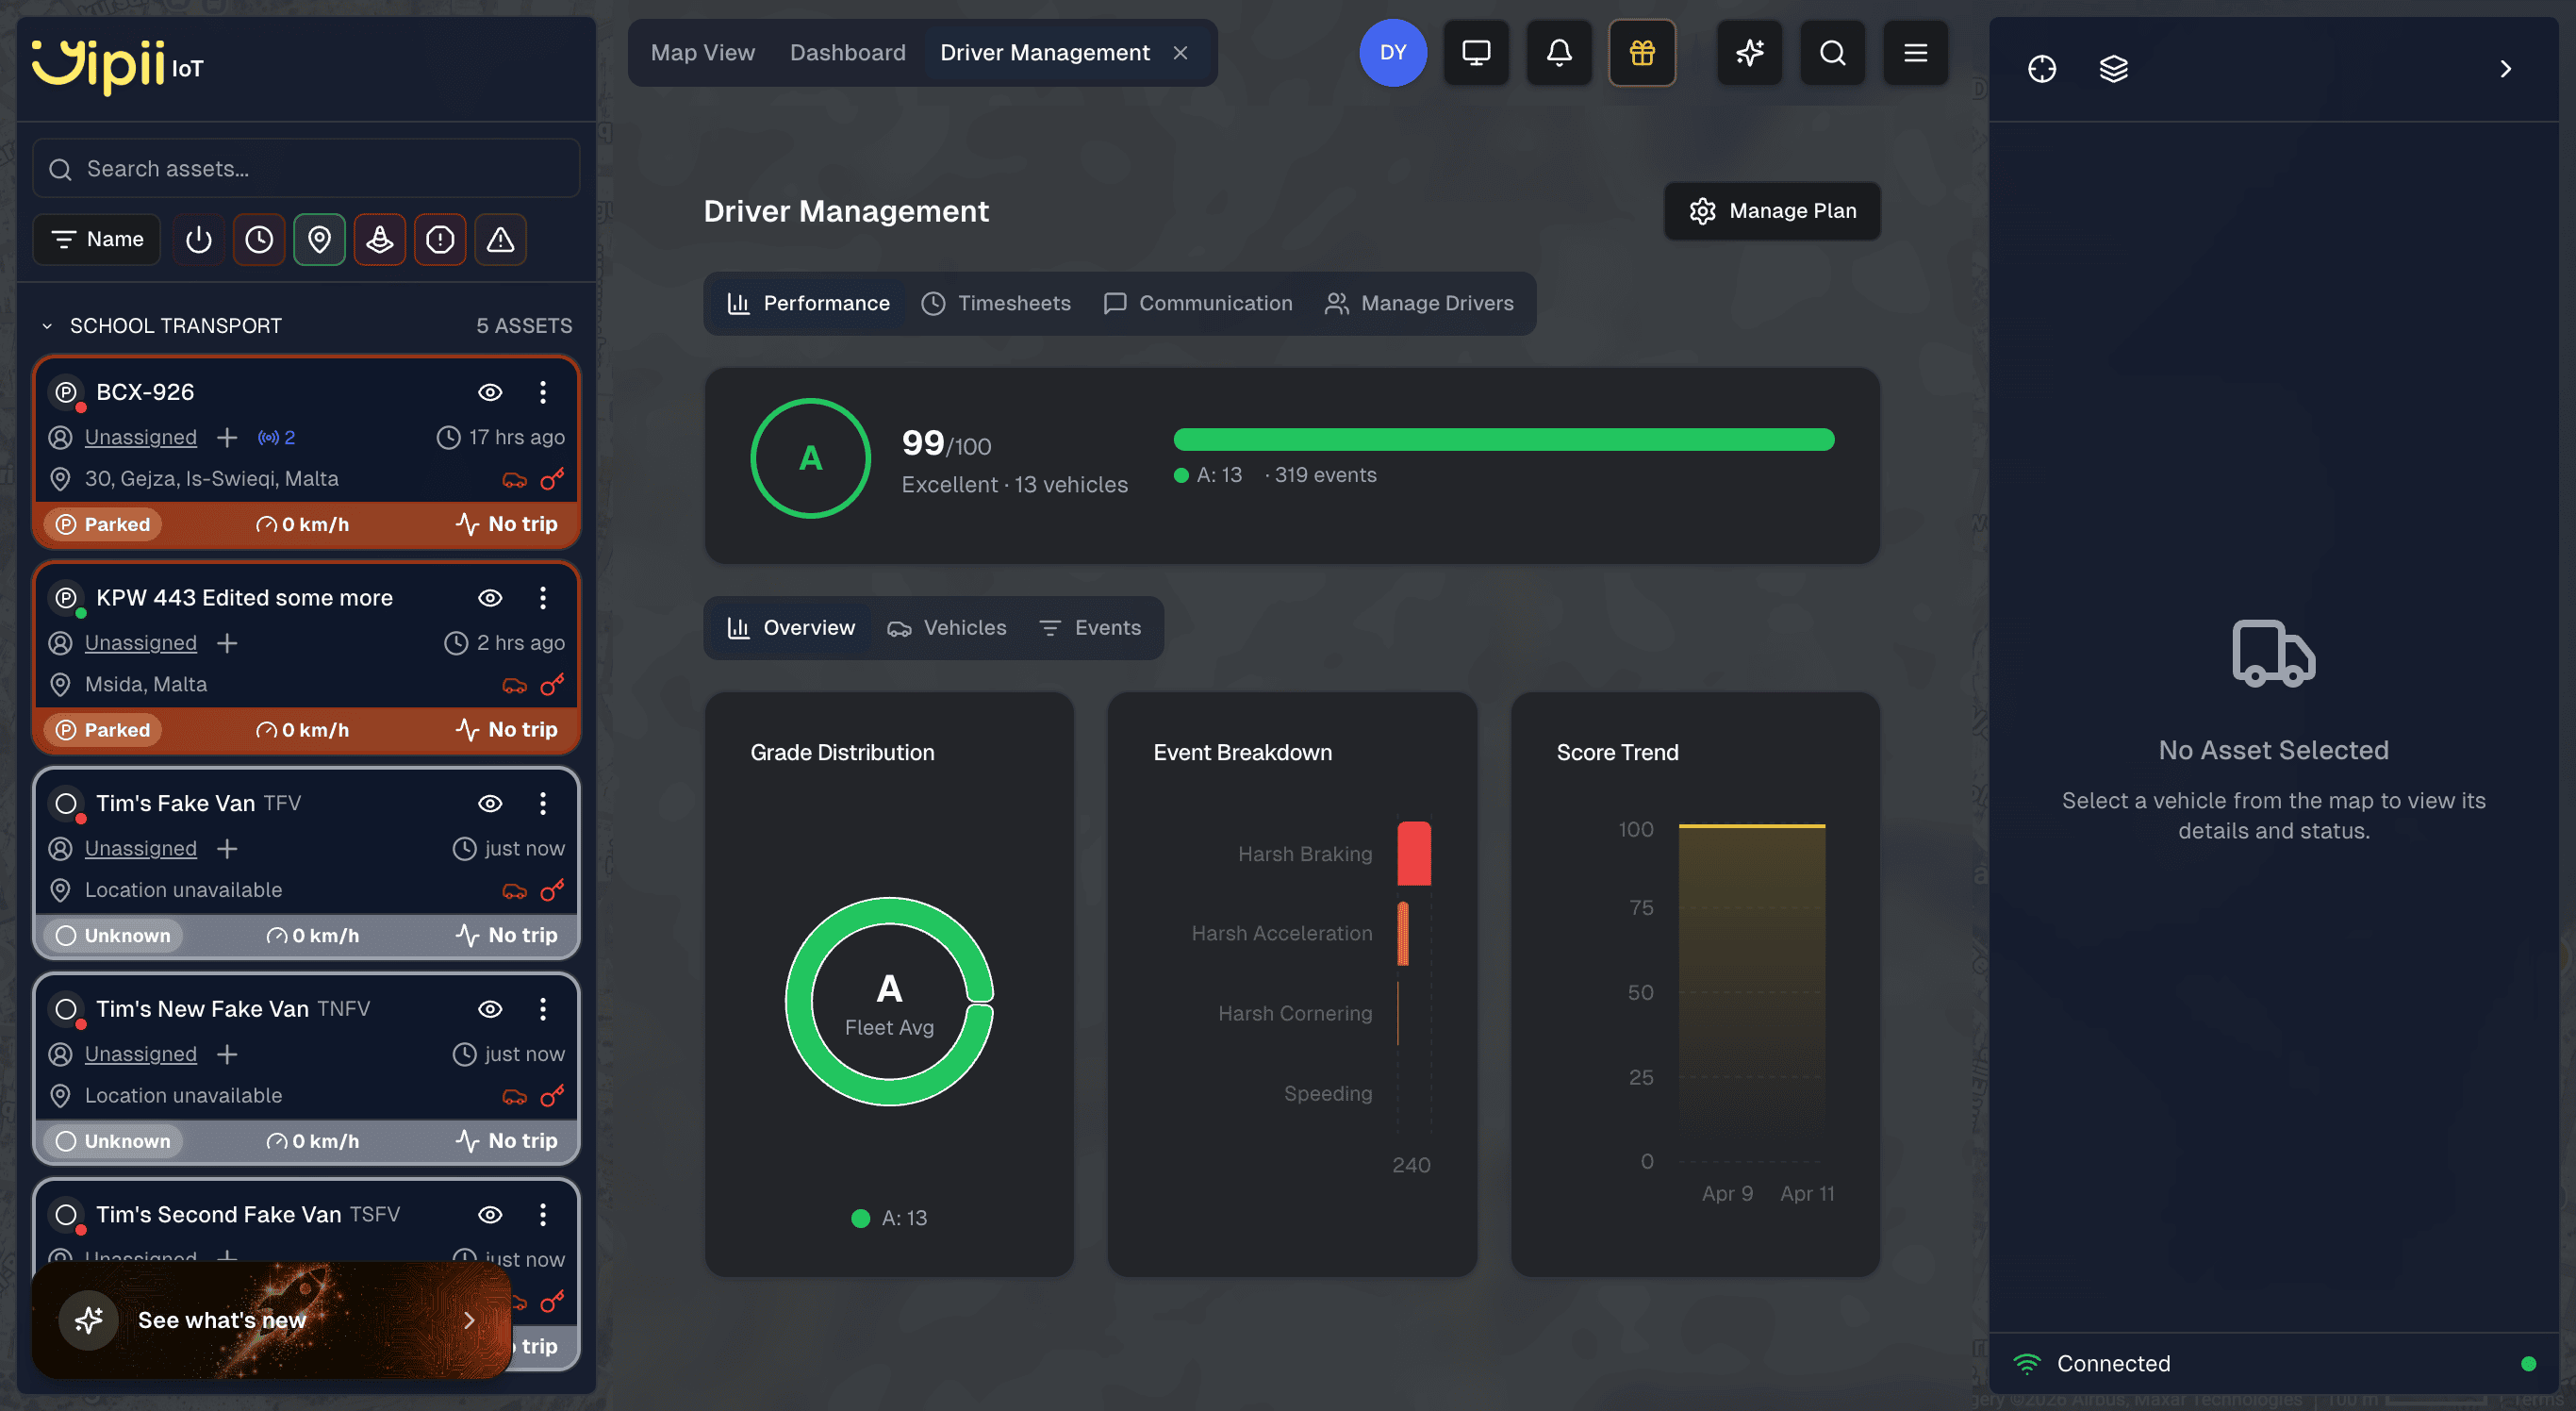
Performance carries the scoring, and splits into three:
| Sub-tab | What it gives you |
|---|---|
| Overview | Grade distribution, a breakdown of which event types dominate, and the score trend over time |
| Vehicles | Every vehicle with its score and grade. Sorted worst-first, on purpose |
| Events | Individual events, timestamped and mapped. Click one to see where it happened |
The Vehicles list opening on the worst scores is a deliberate choice: the top of the list is where the work is.
Using it for coaching
A score on its own changes nothing. The sequence that works:
- Start with Overview → event breakdown. If the fleet's problem is cornering, coaching people about braking wastes everyone's time.
- Take the bottom three from Vehicles. Not the bottom fifteen. Three is a conversation; fifteen is a memo nobody reads.
- Open their Events and look at where. A cluster of harsh braking at one junction is a road problem, not a driver problem, and telling a driver otherwise loses you their trust.
- Re-check the trend in a month. The Score Trend chart is the only honest proof that the coaching worked.
Point 3 is the one people skip. Roundabouts, badly-timed lights and a steep yard exit all generate harsh events from careful drivers.
Timesheets, Communication and Manage Drivers
- Manage Drivers — the driver records themselves, and which vehicles they are assigned to.
- Timesheets — GPS-verified clock-in and clock-out.
- Communication — messaging drivers from the platform.
Timesheets and the driver portal need the Driver add-on. Manage Plan on the same page shows what your account has.
What can distort a score
| Cause | Effect |
|---|---|
| A vehicle with no driver assigned | The score exists but belongs to a registration plate, not a person |
| Tracker mounted loosely | Vibration reads as harsh events. A vehicle that scores badly across every driver is a mounting problem |
| Very short trips | A handful of trips gives an unstable score. It settles with distance |
| Rough roads and speed bumps | Genuinely generate events. Compare vehicles on similar routes |
| A shared vehicle | One score, several drivers, no way to tell them apart without driver ID |
If it doesn't work
| Symptom | Cause | Fix |
|---|---|---|
| Every vehicle scores 100 | No harsh events recorded — either good driving or no data | Check the Events tab. Empty across the whole fleet means data, not driving |
| A vehicle has no score | It has not driven in the period, or has no tracker | Widen the period |
| Scores are attributed to vehicles, not people | No driver identification | Assign drivers, or fit iButtons or beacons |
| One vehicle scores terribly on every driver | The tracker is loose | Re-check the installation before coaching anyone |
| Speeding events on a legal journey | The threshold sits at the limit, so GPS noise trips it | Compare against the Events map before treating it as real |
| The Timesheets tab is locked | It needs the Driver add-on | Open Manage Plan on the same page |
| Scores here disagree with the dashboard's Driver Behavior | Different sources. This page uses movement data; the dashboard widget uses OBD-II | Both are right. This page covers more vehicles |
Related
- Dashboard — the OBD-based Smoother / Safer / Eco scores.
- Beacons — driver identification, which turns vehicle scores into people scores.
- Reports — driver behaviour and driver score reports for a period.
- Alerts — to catch speeding as it happens rather than in a monthly review.
Was this page helpful?